Hi all,
I’m still working with Qwt and looking at some forums I found various questions about the default value of the axis of a plot, something like “the problem is when i click on zoom button it is adjusted to 1000 automatically“.
This is really a not easy question for a new Qwt user because the example reported in the Qwt pack are not so clear about it (in my opinion, of course).
In this post I will try to make some examples to solve this problem.
This is the code of the zoomer created and used in bode.cpp, the main file of the bode project (an example of the Qwt pack):
class Zoomer: public QwtPlotZoomer
{
public:
Zoomer(int xAxis, int yAxis, QwtPlotCanvas *canvas):
QwtPlotZoomer(xAxis, yAxis, canvas)
{
setSelectionFlags(QwtPicker::DragSelection | QwtPicker::CornerToCorner);
setTrackerMode(QwtPicker::AlwaysOff);
setRubberBand(QwtPicker::NoRubberBand);
// RightButton: zoom out by 1
// Ctrl+RightButton: zoom out to full size
#if QT_VERSION < 0x040000
setMousePattern(QwtEventPattern::MouseSelect2,
Qt::RightButton, Qt::ControlButton);
#else
setMousePattern(QwtEventPattern::MouseSelect2,
Qt::RightButton, Qt::ControlModifier);
#endif
setMousePattern(QwtEventPattern::MouseSelect3,
Qt::RightButton);
}
};
MainWin::MainWin(QWidget *parent):
QMainWindow(parent)
{
d_plot = new BodePlot(this);
d_plot->setMargin(5);
#if QT_VERSION >= 0x040000
setContextMenuPolicy(Qt::NoContextMenu);
#endif
d_zoomer[0] = new Zoomer (QwtPlot::xBottom, QwtPlot::yLeft,
d_plot->canvas());
d_zoomer[0]->setRubberBand(QwtPicker::RectRubberBand);
d_zoomer[0]->setRubberBandPen(QColor(Qt::green));
d_zoomer[0]->setTrackerMode(QwtPicker::ActiveOnly);
d_zoomer[0]->setTrackerPen(QColor(Qt::white));
d_zoomer[1] = new Zoomer(QwtPlot::xTop, QwtPlot::yRight,
d_plot->canvas());
….
void MainWin::enableZoomMode(bool on)
{
d_panner->setEnabled(on);
d_zoomer[0]->setEnabled(on);
d_zoomer[0]->zoom(0);
d_zoomer[1]->setEnabled(on);
d_zoomer[1]->zoom(0);
d_picker->setEnabled(!on);
showInfo();
}
….
The class is defined inside the main file, not in an header.
The only thing about the zoomer that you can find in bode.h is:
private:
…
QwtPlotZoomer *d_zoomer[2];
…
So, if you run the bode example, you do not have to face the problem of the default value.
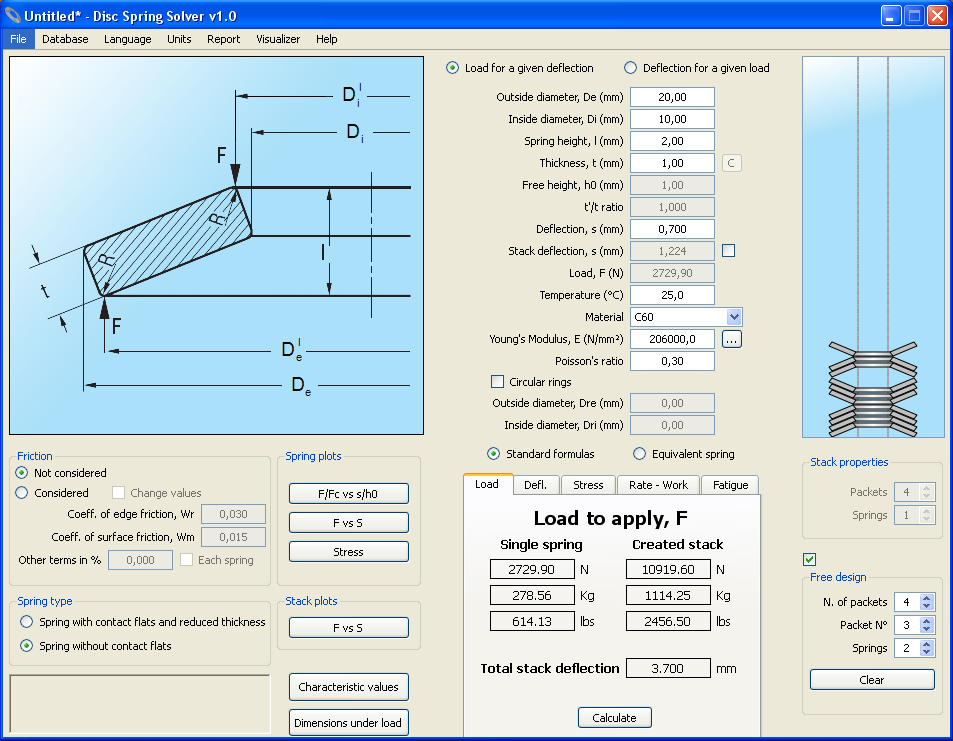
Let’s look at what happens if you use this code in your programs when the zoomer class and the plot constructor are in plot.cpp and a plot object (with a curve) is created in the main.cpp with a code like this:
Plot *CFPlot = new Plot;
CFPlot->setWindowTitle(“F vs s”);
CFPlot->setTitle(“F vs S”);
CFPlot->setAxisTitle(2, “s (mm) –>”);
CFPlot->setAxisTitle(0, “F (N) –>”);
// Insert new curves
QwtPlotCurve *cFS = new QwtPlotCurve(“F (N)”);
#if QT_VERSION >= 0x040000
cFS->setRenderHint(QwtPlotItem::RenderAntialiased);
cFS->setRenderHint(QwtPlotItem::RenderAntialiased);
#endif
cFS->setPen(QPen(Qt::red));
cFS->attach(CFPlot);
cFS->setData(MyX,MyY, 101);
…
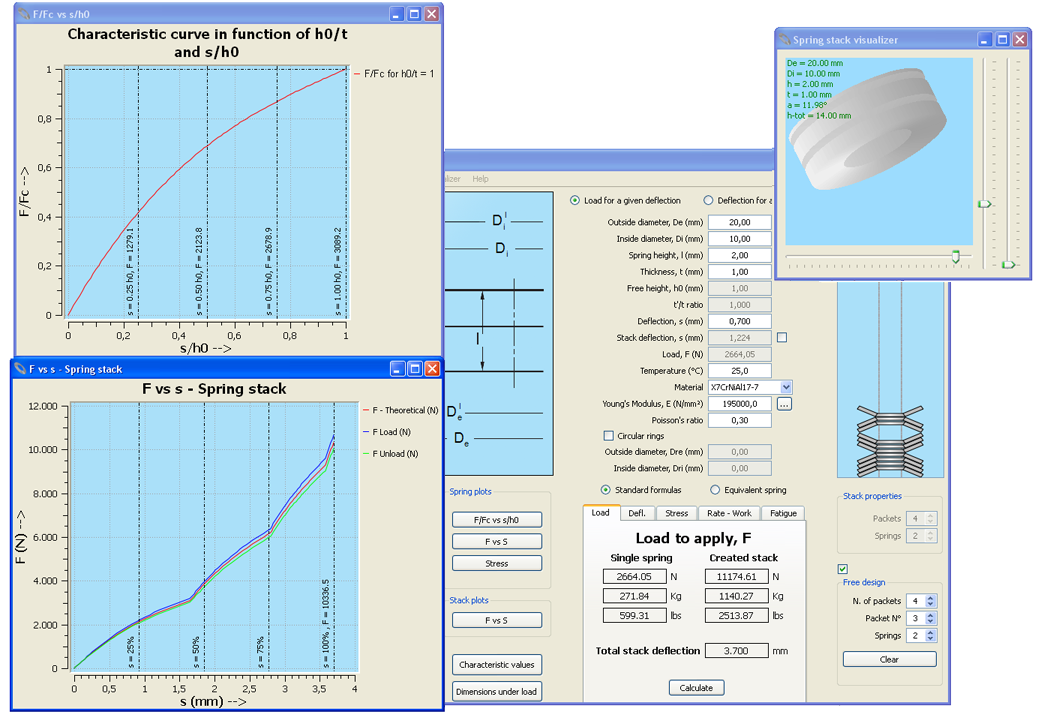
The plot A is what you obtain at the beginning, while the B and the C is what you obtain by clicking the right button when the zoom level is 0 or by zoomin on a region where y (or x) is alway >1000 (the default axis value):

As you can see, in the first case the plot is still working while in the second case the plot is not working at all: the axis markers and the grid are completely off and also the picker indicates always (0.00, 0.00).
To avoid this behavour you just have to remove the “private:” definition from the plot.h file making *d_zoomer[2] public and to use setZoomBase in this way:
cFS->setData(corsax,caricoy, 101);
CFPlot->d_zoomer[0]->setZoomBase();
CFPlot->d_zoomer[1]->setZoomBase();
In some particular cases you will also need to do replot using CFPlot->RePlot();.
So, after the date setting of the curve you have to re-set the zoom base, if you have added more than one curve to your plot you just have to wirte those rows after the data setting of the last added curve.
In this way your zoomer will be full working!